Meeting new people just got way more fun, because now you don't have to do it alone.
With Tinder's new Double Date feature, you and your bestie can match together.
Tap the Double Date icon to see profiles built for two.
When two pairs match, the group chat kicks off.
Scope the profiles.
Send memes.
Flirt a little.
Maybe plan a hang.
It's always better when you're in it together.
Try the new Tinder Double Date.
Explore all the possibilities.
Tinder.
It starts with a swipe.
Download Tinder today.
Scientific American is turning 180.
To celebrate, join our photo challenge, Siam in the Wild.
It's easy.
Just snap a pic of any Scientific American print issue in a setting that reflects or complements the cover theme.
Then share it on social media using hashtag Siam in the Wild tag Scientific American and include your name and location, or you can email it over to us at contests at Siamcom.
You could win a one-year unlimited subscription plus a bundle of awesome gadgets and gear to fuel your next adventure.
But hurry, entries close September 5th.
Terms and conditions apply.
See official rules at Siam.com slash 180 contest.
That's Siam.com slash 180 contest.
That link is also available in our show notes.
We can't wait to see where curiosity takes you.
For Scientific American Science Quickly, I'm Rachel Feltman.
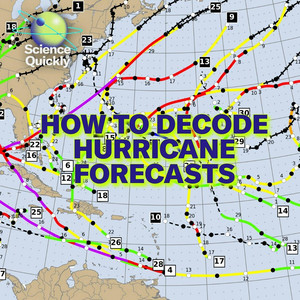
While scientists have gotten much better at predicting where hurricanes will go, there's still a lot of confusion about what forecast maps can actually tell us.
That cone of uncertainty, for instance, it probably doesn't mean what you think it means.
Here to break down how to read these crucial forecasts and to explain why you should keep checking them, even after you think you know what a storm will do.
Is Andrea Thompson, Senior News Editor for Sustainability at Scientific American.
Thanks so much for coming on to chat with us.
Thanks for having me.
So let's start by just reminding our listeners when hurricane season is, because I feel like a lot of folks just kind of associate hurricanes with summer in like a spiritual sense.
But we're still really in it, aren't we?
We are.
So hurricane season, the actual dates are sort of artificially imposed.
They run from June 1st to November 30th for the Atlantic Ocean.
And that's just because those dates encapsulate the vast majority of hurricane formation.
We do sometimes see hurricanes form before June 1st or after November 30th, but they're rarer.
And we do associate hurricane season with the summer, but the peak of the season is actually at the very end of that.
The peak of the season runs from about mid-August until October.
So September is really kind of the prime time for hurricane season.
Yeah, so people should definitely still be prepared to see some hurricane alerts in the coming weeks, which is why I was so excited to see your piece about decoding and demystifying what those forecasts mean.
So let's start with.
What is the code of uncertainty which, as you pointed out in your piece, really sounds like something kind of mystical?
Yeah, exactly.
So really it's just meant to say that Show where the hurricane is most likely to go, and specifically the center of the hurricane.
So there's often a misinterpretation of it that oh, it encompasses where the hurricane impacts will be.
So if you're outside of the cone, you're safe.
That's not true at all.
It's just meant to show.
Okay, this is where we think the center of the storm is most likely to go in the coming days.
And you know, sort of the center of that cone is the most likely track, but anything within it is sort of possible.
And that cone is based not on the range of model output.
It's based on the average error that the forecasters have had in their track forecast over the past five years.
So if I'm looking at this cone of uncertainty, what information can I get out of it?
You know, what should my takeaways be about where this storm is going and what it might mean for me?
So it's really a good sort of first take.
If you see, and we have an example in the story of Hurricane Milton.
So you could see that storm last year.
And if you were in say, New Orleans, you could look at that cone of uncertainty and say okay, it's really covering Florida.
I am far enough away that it's probably not... a big deal to me.
But if you were in say Pensacola, you couldn't necessarily do that, because you're close enough to the cone that you might still feel some of the influence of the storm.
And because storm tracks can change you kind of OK, maybe I need to just be watching this, but it's not a I have to evacuate right now kind of situation versus say, if you were in Tampa, you really need to pay attention to the storm because you were sort of right in the center of that cone of uncertainty.
So it's sort of just a first take of do I need to pay attention to this?
Do I not?
And then it's, you know, if you are in the area of threats.
It's not going to tell you that much about what the actual threats are from this specific ethic.
Yeah, we'll definitely get into where you start looking for that information as forecasts build in more information about threats.
But looking at this initial sort of big cone forecast.
What can it tell us about the timing of the storm?
Yeah, so it will look out over either three to five days, depending on which view you look at on the National Hurricane Center website.
And it basically runs every 12 hours.
So here's where it'll be at 7 a.m. on Monday, 7 a.m. on Tuesday.
And that just gives you sort of a look at the progress of the storm and when a storm sort of might be hitting a particular area at sort of designated points in time, looking out.
And I would assume that you know, similar to the trajectory being about the center of the storm, the sort of when the storm hits might not necessarily tell you when you might see some impacts from the storm.
Is that right?
Yeah.
So because the cone of uncertainty is talking about the center of the storm, the storm extends far out from the center.
That can range a lot.
There's a big variation in the size of storms.
And so you are often feeling the outermost what they call bands of the storm well before the center would actually hit you.
That can start with tropical storm force and build up to hurricane force, depending on where you are in relation to the hurricane.
Yeah.
Well, in August we had a great example of that in the Northeast and along the East Coast where we had crazy riptides because of Hurricane Erin.
Even though you know if you were looking at sort of the track of the hurricane you would be like it's still out of the ocean.
It's fine.
But apparently no one could go swimming.
So it was not fine.
And yeah, speaking of strength, what can that code of uncertainty tell us about what we can expect from the strength of the storm, and what information should people actually take away from that versus what's still very much up in the air?
Right.
So it has color coded circles with letters in them and those are just sort of a rough first look at the strength of the storm.
So if there's an S, it's a tropical storm.
H is hurricane.
M is major hurricane, which means category three or higher on the five category Saffir-Simpson scale.
And that's based solely on wind speed.
And that's another really important point about the cone of uncertainty is that the only threat it really gets at is wind speed threat.
And that is definitely not the only threat from a hurricane.
Storm surge is another one and rain is another one.
So you're not getting the information really on those threats if you're just looking at the cone of uncertainty.
It will also tell you whether the storm is tropical, or what they call post-tropical or extra-tropical.
And that just has to do with sort of where the storm is getting its power.
A tropical storm is powered by convection.
So it's pulling up warm, moist air.
And that's sort of driving the engine at its center versus extra-tropical storms, which are sort of the weather fronts that we typically associate day to day when you have a rainy day.
So the cone of uncertainty.
There's a lot of information built in, but it kind of boils down to like this is a first glance, major takeaways.
Is this anywhere near me?
Do I need to be paying close attention to forecasts?
But once people realize that they might be somewhere near the projected path, where should they be looking for more information, and what kind of information should they be looking for?
Right.
So one of your best points of information is any trusted local weather source.
So that could be your local TB weather person.
That could be the local National Weather Service office, because they're the ones that are sort of taking the high level information from the National Hurricane Center and then looking at what does that mean for our specific area?
Because the hazards from a hurricane can be really localized, especially things like storm surge or rain hazards.
Storm surge is.
How high it gets is based not just on, you know, the wind speeds of the storm and how big it is, but the topography of the coast itself.
That can vary a lot over a short distance.
So you know, looking at those local sources is going to give you a much better sense of depth what you face specifically where you are.
There are some other tools that aren't just listening to the TV broadcast or whatnot.
The National Hurricane Center does put out detailed maps showing expected storm surge levels, and those are a product of dedicated funding and research into how to better model storm surge and how to present it to people in a way that's helpful.
With those maps you can get pretty detailed.
Look at the coastline and what the expected levels of storm surge is all the way along the coast.
There is also something called the Hurricane Threats and Impacts Tool, and that comes from the National Weather Service.
Basically, that takes all of the localized forecast from our hurricane, from all the various weather service offices that are in the area where the hurricane might hit, and puts them all together so you can look at where you are and see here's my storm surge threat, here is my rain threat, here is the wind threat, and get a sense of all of those and what are the things you need to be paying attention to.
That can be helpful just in terms of like okay, Am I really in the storm surge area or am I kind of outside it?
But you really need to pay attention to local emergency managers and other local officials.
And if they give orders to say evacuate, really heed those, because they are looking at this detailed information and saying OK, these areas are under significant enough threat that we don't want people there and in harm's way.
Well, and I think the last point to really hit on is that, as you mentioned in your piece, forecasts do change and people have a tendency to see a bunch of information be like great.
I have checked the forecast.
I know what the storm is doing and then sort of move on.
But That's not really how storms work, right?
So storms can and do change pretty quickly.
You know we are pretty good now at forecasting storms and sort of catching some of these changes that before forecasts would not have been able to get.
But you know there are still surprises and a five mile difference in where a storm actually makes landfall can make a pretty big difference to the impacts on the ground, depending on where you are.
And storms do still sometimes change intensity really quickly, especially what we call rapid intensification, where they jump up in strength really fast.
And that can make a big difference to the impacts that are felt.
And if you were looking at a forecast two days ago and said oh, it's only supposed to be a tropical storm when it hits, and then aren't paying attention, you're going to get a big surprise if it's now say, a Category 4 hurricane.
Right.
So we're pretty good at telling people whether the storm is going to be anywhere near them.
But if it's going to be anywhere near you, the impact it could have is sort of subject to change.
So you want to pay attention to that.
Well, thank you so much for coming on.
You always do such a great job demystifying the weather for us.
So I really appreciate it.
Yeah.
Happy to be here.
Thanks.
That's all for today's episode.
Subscribe to Scientific American for more up to date and in-depth science news.
For Scientific American, this is Rachel Feltman.
See you next time.
Amazon presents Yancy vs. Dorm Hall Bathroom.
Some bathrooms offer quaint amenities.
The Dorm Hall Bathroom offers a level 7 airborne virus for your feet.
But Yancy shopped on Amazon and saved on shower sandals, oversized bath towels and antibacterial body soap.
His opponent played dirty, but Yancy kept it clean.
Save the everyday with College Deals on Amazon.