Chat with Traders is brought to you by Trade the Pool.
Becoming a funded trader means trading with a firm's money instead of your own.
At Trade the Pool, you first complete an evaluation by hitting profit targets while managing risk.
Once you pass, you get access to up to $260 ,000 of buying power.
You keep up to 80 % of your profits while the firm covers the risk.
It's the perfect way to trade big without risking your own funds.
Are you ready to become a funded trader?
Join Trade the Pool.
Chat with Traders is also brought to you by Tasty Trade.
Ditch those rookie trading apps.
Get Tasty Trade, the platform for serious traders.
Chart with 300 plus indicators, know your profit odds and move fast.
Trade stocks, options, futures, and more, all in one account.
See why serious traders choose Tasty Trade.
Visit TastyTrade .com.
Tasty Trade Inc. is a registered broker dealer and FINRA, NFA, and SIPC member.
Trading in the financial markets involves a risk of loss.
Podcast episodes and other content produced by chat with traders are for informational or educational purposes only, and do not constitute trading or investment recommendations or advice.
I am a gold bull, by the way.
If we're getting into confessionals here, it's something that I've traded and I've followed, you know, for many, many years.
But what's going on is pretty interesting because the gold breakout, normally, by the way, the dollar is extremely strong.
The dollar is in a huge bull market.
And usually when that happens, gold is not in a bull market.
If you get dollar strength, you'll get gold weakness, usually, but that's not the case now.
So that makes this breakout kind of unusual.
Market speculation and risk.
This is the chat with traders podcast.
Hello and welcome to chat with traders, episode 280.
This is Tessa Dow, Ian Cox's co -host, who you will be hearing from very shortly interviewing our special guest today.
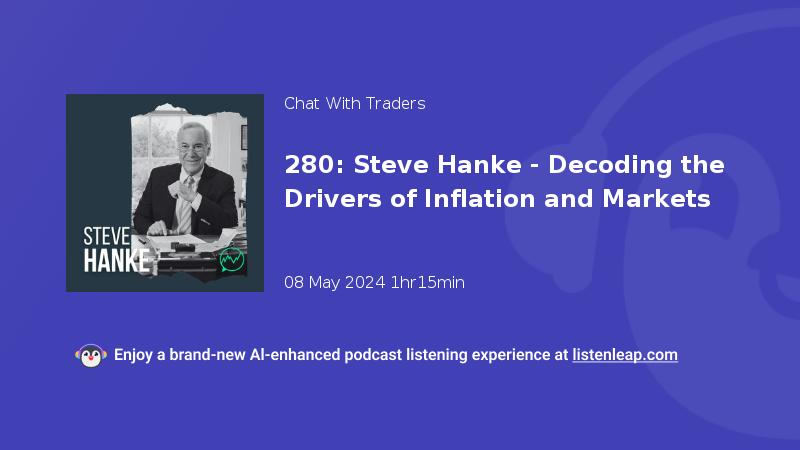
Our guest is Professor Steve Henke.
Many of you know Professor Henke as an economist and professor of applied economics at the Johns Hopkins University in Baltimore, Maryland.
Professor Henke is known for his work as a currency reformer in emerging market countries and served on President Reagan's Council of Economic Advisers.
Very recently, Washingtonian magazine recognized Professor Henke in their annual list of Washington DC's 500 most influential figures in shaping public policy.
And did you know that Professor Henke also trades?
He had his first exposure to the markets and started trading commodities when he was just 14 years old and started learning the importance of closely following macroeconomic factors which impact the prices of currencies, commodities and consumer goods.
Professor Henke's evidence -based approach uncovers the deeper forces driving inflation and market fluctuations and challenges prevailing narratives as it relates to economics.
By exploring macro topics often overlooked by the mainstream, Professor Henke broadens our collective understanding and invites us to think more deeply and critically about the economic forces shaping our world.
Now without further ado, ladies and gentlemen, we are so honored to present Professor Steve Henke, currently in Baltimore, Maryland.
Hello everyone. I would like to welcome Professor Steve Henke of Johns Hopkins University.
He is a professor of applied economics and he served on former President Reagan's Council of Economic Advisers.
Professor Henke, welcome to Chat with Traders.
Ian, great to be with you.
How are you doing? And where are you right now?
I'm doing very well.
I'm today in Baltimore, Maryland and that's 88 degrees Fahrenheit.
Probably the warmest day we've had so far this year.
Sounds yeah, broiling over there.
So let's dive into your background.
Kind of where did you grow up and how did you get exposed to the financial markets?
I grew up in rural Iowa, Southwest Iowa and was exposed to commodity markets almost from birth because that's what happens in Iowa.
You grow corn, you grow soybeans, you grow alfalfa and bale hay, hogs, cattle, you name it.
But my real introduction came actually over more or less 70 years ago.
And that is my grandfather had a big egg operation and they would collect the eggs from the farms, bring them in, candle them, sort them, grade them, clean them and put them in cold storage until they had accumulated a semi full of eggs to ship back to New York or Boston.
And there was a time interval between the time that you put the eggs in storage and the time that you actually shipped them back East.
As you know, with any commodity, as time goes by, there's price risk.
There's prices going up and down and so forth.
In those days, the Chicago Mercantile Exchange had an egg contract, futures contract.
And so if he didn't want to take the price risk and the price looked pretty good, he'd sell the eggs forward.
And so I learned how to do that with my grandfather.
I was about 10 years old and then by the time I was 14, I did open my own trading account and it was trading what?
Commodities, mainly soybeans.
So it's just part of life there.
I mean, it's all based on agriculture and agricultural commodities of one sort or another.
So at age 14, they allowed kids to open up their trading account?
Well, they did, this was probably illegal today, but anyway, I opened an account, had no problem with it.
I knew the local who was the broker for the brokerage outfit at that time.
Maybe you could share with us what has been the most memorable trade that you've ever done?
Probably several, but in 1985, I became chief economist at Friedberg Mercantile Group in Toronto, which is the biggest commission merchant or was at the time anyway.
I think it still is in Canada.
Al Friedberg established that and still, they had man there and a great trader, one of the Canadian billionaires.
At any rate, I had modeled the oil cartel OPEC and had concluded that OPEC was gonna collapse and oil was gonna go below $10 a barrel.
And that was in late 1985.
And of course in 86, it did exactly what I anticipated it would do.
So it was a huge trade and we had massive short positions on crude.
After the fact, we found out that we had about 70 % of the short interest in the London market.
So we had very big positions.
That was a pretty spectacular.
And then there were others that the collapse of the Russian ruble in 1998, I actually had given a speech, I think it was in February of 1998 in Vienna and I observed that the net foreign asset position at the Russian central bank was going down very fast and to compensate for that decline, the net domestic assets
were going up on the balance sheet very fast.
And that's when you see that kind of thing happen, you know, there's trouble in the winds.
And I indicated that and a Reuters reporter happened to be reporting on the thing.
Minute the thing hit the wire, the ruble went down 3%.
And I knew I was onto something.
And so obviously put some short positions on and the ruble did collapse spectacularly in August of 1998.
You probably remember that.
I mean, it was a pretty big deal.
So both of those were big international things.
OPEC collapsing, oil prices going below $10 a barrel in 1986, that was a big deal.
And then the ruble in 1998, but there've been other trades and in 1995, I was a president of Toronto Trust Argentina in Buenos Aires.
And that was the best performing fund in the world in 1995.
So that was not one trade, but the portfolio was a big winner.
It was the best one in the world.
Great, thanks for sharing.
So I'd like to dive into the Fed's decision on interest rates yesterday.
I'd like to get your thoughts on this interest rate decision.
And where do you think we go from here?
Well, the Fed basically said that inflation is pretty sticky.
It's not going away because we've had basically three months of kind of sideways movement in the consumer price index in the United States.
It hasn't continued to fall as it had been falling.
So Paul, Chairman Powell said it's going to be higher rates for longer, kind of steady as you go, no change.
And if you look at the futures market for Fed Funds, it looks like the Fed Funds futures market doesn't anticipate anything until probably getting into the fall sometime.
So they keep pushing back the timeline for when they expect the Fed to lower the Fed Funds rate.
Now, Paul did indicate that they were going to back off the quantitative tightening, that is reducing the size of the balance sheet and the bond, government bond runoff that they've had.
That is a loosening.
So he's talking about staying the course with the Fed Funds but in fact loosening a little bit on the quantitative tightening.
So that's what he said.
And we don't know when he will change because the Fed is data dependent.
They just look at the daily data and see what's happening in the various markets.
And then they decide it's basically a finger in the wind operation.
Are we going to tighten or not?
So you don't know what they're going to do.
They can pivot tomorrow one way and then the next day they'll pivot another way depending on what the data are saying.
This is a wrong -headed approach.
They should be looking at the quantity of money which they're not looking at.
They're not paying any attention.
They look at the like what they call a financial conditions indices.
They have a bunch of financial indicators on interest rates, interest rate spreads, shape of the yield curve, all of this kind of stuff which all these data points are looking at are moving around but that movement is caused by something that happened prior to those changes.
And that's determined by changes in the money supply.
So you have to embrace the quantity theory of money that money as a fuel of the economy, if you goose it, the asset prices are going to go up, commodity prices are going to go up with a lag.
And then another longer lag, economic activity is going to start changing.
It'll go up. And with even a longer lag, inflation is going to start moving.
So where are we as I see it?
We're in a situation where the money supply is actually contracted since early 2022.
It's gone down. I mean, it's smaller now than it was back in 2022.
This has only happened four times in the United States.
You've got to go back into 1949 to pick up the first time you got a contraction.
And of course that was followed by a recession.
And then you go back to 1936, 37, there was another contraction that was followed by a recession.
You go back to 1929, 1933, and of course you had a huge contraction in the money supply and a great depression.
And then the fourth one, you go back, I think it's 27, 28, I can't remember for sure, but you had a recession.
So all these contractions do what the quantity theory of money tells you or anticipates the contraction should do and that's caused a slowdown.
That's why I can say with confidence that a slowdown is baked in the cake in the United States because of what happened a year and a half, two years ago, two and a half years ago with the money supply, contracting, contracting.
So we anticipate John Greenwood and I do this work together.
John is a fellow at the Johns Hopkins University at my Institute for Applied Economics.
And was for many years a chief economist at VESCO until he retired a little over a year ago.
So economic activity slowdown is baked in the cake.
The other thing that's baked in the cake is that we will eventually start moving down again with the consumer price index.
So it'll start going down and we will get down to that 2 % inflation target that the Fed has.
Maybe it won't come by the end of this year which John and I originally thought maybe it'd be a little bit longer.
But you have to remember that the tricky thing about this again is that there are long and variable lags between changes in the money supply and changes in all these indicators.
So to put your finger on exactly when something's gonna happen is kind of a fool's game.
But you do know it's gonna happen.
That's why the baked of the cake thing comes.
So why is the Fed engaged in this quantitative tightening and how much of the decrease in the money supply is attributed to the Fed's actions versus the banks not lending as much as they used to?
From my understanding, banks are primarily responsible for the majority of new money creation.
So how much blame can we put on the Fed versus the banks?
And why are they doing this?
The Fed's policy framework influences the banks.
The Fed is always behind the curtain either directly or indirectly.
If you look at the money supply, the Fed actually, the base money, what's measured by M sub zero, they're responsible for about 11 % of the total money outstanding.
And bank deposits, liquid bank deposits account for about 76%.
So banks are the elephant in the room.
And then you've got a small retail savings accounts.
That's another 5 % of broad money into, and then money market funds are about 8%.
So the commercial banks are a big deal and they have contracted.
They're part of the contraction.
I see. And now the bank credit is basically year over year, more or less flat.
So do you think that can fiscal policy actually overwhelm monetary policy?
You know, you know, right now with a trillion dollars being added to the debt every hundred days.
No, money dominates.
But money, money always dominates fiscal policy.
The best way to look at this, the best examples that clarify exactly what I'm saying here.
If you look at Japan in the 1990s, for example, in 1990, the money supply was growing at 13 % per year.
And then it collapsed in 1990 to no growth from 13 to zero.
So you had a huge slow down in the money supply.
It was very tight. And ever since then, by the way, the money supply has been growing at about 2 % to 4 % in Japan, it's been very tight.
Now it's growing at 2 .5 % per year in Japan, very tight.
It's always been very tight for, you know, we got 30 years, a little over 30 years.
When I say tight, it's tight because hankie's golden growth rate for the money supply measured by him too in Japan, that would be consistent with hitting an inflation target of 2 % is about 5%.
So you can see these, all these numbers I've been giving you the two to 4 % range, that's low, tight, tight, 2 .5, the current number is tight.
And what about the fiscal side?
The fiscal side is loose.
The loosest fiscal situation in the world, that the GDP ratio in Japan's about 260%.
So you have very tight monetary policy and ultra loose fiscal policy.
And what's happened to economic growth and inflation in the last 30 years in Japan.
They can't get their inflation rate sustained up to 2%.
It's been generally below 2 % all those 30 years while they've been expanding the fiscal side fantastic.
Deficits and fiscal expansion.
So that is one example where money dominates.
The other clear example is the US in the 1990s.
The fiscal policy was very tight.
President Clinton actually reduced government expenditures by more than any president and in relative terms by the way that we've had since World War II.
Clinton was very, very tight fiscal.
He reduced government expenditures by 3 .9 % eight points in his two term as president.
And the last two years of his presidency, he actually ran fiscal surpluses in the United States.
So he was a very tight fiscal policy.
At the same time, we had accommodative, I think appropriate monetary policy.
The Greenspan was a chairman of the Federal Reserve and we had monetary policy running.
You know, monetary growth M2 was running about 6%.
More or less 6%, which is consistent with Hahnke's golden growth rate.
The golden growth rate consistent with hitting a 2 % inflation target.
Inflation in those two years was actually just a little below 2%.
So money dominates.
The Japanese example in the 90s going forward, very tight monetary policy, very loose fiscal policy.
And what do you end up a slow economy and very low inflation.
In the US, you had a very tight fiscal policy in the 1990s.
I wouldn't say loose, but kind of optimal monetary policy.
And you had very rapid economic growth and inflation that was low.
So why is it that from all the economists in the government and Chairman Powell and everything, I don't recall hearing much of anything about the money supply.
Why don't they focus on that?
I mean, they have certainly have a large team of economists, think tanks.
Why are they so obsessed with interest rates and not the money supply?
Chat with Traders is brought to you by Tasty Trade.
Tired of trading on rookie apps?
Then get the platform for serious trading.
Tasty Trade. Tasty Trade gives you the tools to trade your way.
Chart your heart out with over 300 indicators.
Know your odds with probability of profit and move fast with quick roll.
Trade what you want and trade it your way, stocks, options, futures, and more.
All in one account on one platform.
No wonder why serious traders choose Tasty Trade.
Visit tastytrade .com and see for yourself.
Tasty Trade Inc is a registered broker dealer and member of FINRA, NFA, and SIPC.
Hey, I got a great update from Trade the Pool.
Now it's even easier to get funded.
As you know, Trade the Pool built a unique program to evaluate stock traders like yourself and provide you with the company's funds to trade with.
It's real shares, and you no longer need to worry about the PDT rule, but that's not all.
Trade the Pool has introduced a new tier with $20 ,000 in buying power, making it easier to pass the evaluation and speeding up the process of getting funded much faster.
You don't want to miss this opportunity.
Well, I think there's several reasons for this.
In the Fed system, by the way, there are 785 economists.
They have a lot of expertise, shall we say.
I put that in quotes, expertise.
Why don't they look at the money supply?
Why do they deep -sick the quantity theory of money?
One is that the models that they use are post -Keynesian models for macroeconomics, and they don't include an aggregate for the money supply.
So the money supply is not in the models.
All these modern post -Keynesian models that most of these so -called experts have been trained in in their PhD programs, they don't include money.
So that's one reason, the models.
And the other factor I think that is important is the fact that out of the 785 economists, the ratio of Democrats to Republicans is 48 .5 to one.
So there are more or less 50 Democrats for every Republican.
Now you say, well, what's that have to do with anything?
Well, I think it has a lot to do with the situation because Milton Friedman, a known Republican, a Nobel Laureate in economics is basically the Dean of the quantity theory of money.
He was all his macroeconomic model.
The fundamental thing in there is money, and that's of course the model that I use too with the quantity theory of money.
So Friedman's kind of, for any Democrat, Friedman is more or less enemy number one in the economics realm.
So that's another factor.
So it's the modeling, and the composition of the political alignment of the so -called experts of the Fed, those are the main drivers in there, keeping the quantity theory out.
It's just out of fashion.
It's just not only the Fed by the way, but all these models don't include money and all the models are used internationally.
Is this not in the United States?
Is that an ideological stance against the theory of money?
I mean, is there something about Milton Friedman that they say, well, no, we got to what, cancel him and just throw out his?
Well, the political part of it, that does come into play, but the modeling part, it really comes at the university level.
And as I say, they're post Keynesian models for the last 30 years have been the order of the day.
So that's what the academics produce.
That's not what I use, but that's what the majority of the freshly minted PhDs will be exposed to, whether they're in the Canada or the United States or the UK or anything, the content network, you name it.
I'd like to jump to the concept of the leverage and are we in a time period now that could we call this time period, the death of leverage?
Will interest rates of 5 % kill the leveraged economy and investment opportunities?
Well, I mean, obviously the, you know, we had a long time where interest rates were, you know, the minimus and so we did have a lot of leverage and as interest rates go up, there's a big incentive to clean up your balance sheet and get those debt ratios down.
Because if you don't get the debt ratios down in your corporation, you're gonna have problems because when you go to the bank and the bank's looking at your balance sheet and you look like you're over leverage, you've got a problem.
The volatility, now you get two things going on.
One is that the level of interest rates have gone up, but there's now volatility in the thing.
So the combination of the volatility and the higher level of rates is meaning that refinancing or new borrowing by corporations is gonna cost you more and in terms of, so in terms, you wanna deleverage.
And then also in terms of capital budgeting and just basic capital theory, if the cost of whatever you're borrowing is higher, there are many new projects that don't go over the green light zone.
So yeah, so I mean, you know, interest rates play a role and it's all wrapped up with capital theory and Sir John Hicks, Nobel Laureate once said there's nothing more important than a balance sheet.
So whether you're an economist or a bank or financial person or a corporate, or vice president, just CFOs pay attention to this.
These debt ratios, because by the way, all the covenants that the banks have with loans that you have, all have various limits and ceilings put on these debt ratios, for example.
So as interest rates go up and you have to refinance more at higher interest rates, you get yourself into trouble because you start hitting those covenants.
I'd like to jump to the most recent inflation report which shows the economy has slowed to just 1 .6 % annual growth rate.
Is stagflation back?
I don't think so. Stagflation, the last time we had stagflation, slow economic growth and high inflation was in the 1970s, mainly during Jimmy Carter's presidency.
And I'm not saying we want, but it could happen if they, what did they do in the Carter years when we had stagflation?
Well, they increased tax rates marginal taxes went up.
It was kind of an anti -supply side regime.
And we do have that in the United States.
So that's possible.
If these huge budget deficits are deemed to be unsustainable, which they are, there are only two ways to fix it.
One way is to increase taxes.
And the second way is to reduce government spending.
That's how you get rid of them.
Either reduce the expenditures or increase the revenues you're getting from taxes.
And if they go the increased tax route to get the deficit on a sustained basis in the United States that will definitely put a damper on economic growth.
So that would be a slowdown factor.
And then the inflation factor is all dependent on the fed monetary policy.
Inflation is always and everywhere, a monetary phenomenon.
The only way it comes by the way from fiscal deficits is if the fed or whatever the central bank happens to be in the country you're located in starts buying the bonds that are issued to finance the deficit.
And if they do that, that's called monetizing the debt.
It increases the money supply.
And if you increase the money supply you're gonna get more inflation.
Speaking of inflation, I've heard many people in the past argue that the way the government calculates inflation actually under reports actual inflation and that the way that inflation is calculated has changed quite a few times since 1980.
And my question is why has it been changed and do the new changes under report real inflation?
Well, number one, actually the consumer price index started in 1919 and there've been lots of changes in the index.
And so let's step back kind of look at the big picture of the thing, the consumer price index is an index.
And there are lots of things in the index are a lot of goods and services in the basket that over 300 items now.
When you have an aggregate and you're trying to, you have a lot of different dispersed things and you're trying to make an aggregate and we call that an index number, you have a lots of judgments that go into what goes in the index, what are you gonna put in there?
So there's a lot of subjective judgment that goes into it.
So that's one thing.
Then the next thing is after you decide what to put in the index, of course, things change over time.
Are you gonna keep those things in the index or you're gonna keep buggy whips in the index and horses and so forth or are you gonna eventually take them out put cars in there is dynamic is changing all the time.
Then whatever is in the basket, if all those prices of all the items go up and down exactly in proportion to each other, that doesn't pose a problem.
But what if they're going up as they do, some go up much faster than others, some even go down.
So they're moving around, they're everything in the basket is moving around.
What we call relative price changes are occurring all the time.
And so then you have to make another judgment.
Well, how much weight should we put on each one of those things in the basket?
So you have to decide what's in the basket and then what weight do you put on the basket, items in the basket.
As you can see, it's kind of a tricky business and it's highly subjective.
Now, in 1983, there was actually a big change because interest rates used to be in the basket and looking at the consumer price index or so -called cost of living, interest used to be in there.
So your mortgage interest was in there, credit card interest, interest on loans for cars, for example, that used to be included in there.
And financing costs of all kinds of things where interest was associated.
Well, now it's out as a result of that, if you calculated things the way they did in 1983, and you looked at June, 2022, that's when the consumer price index peaked out in the United States, 9 .1%.
By the way, John Greenwood and I, using the quantity theory of money, we nailed that thing.
We predicted that inflation might go up to 9%.
It went up to 9 .1%.
But that's the consumer price index, the way they calculate it now, and that's calculated without interest is not included.
Okay, now, what if we do it the way they did in 1983 and we included interest?
That number would have been 18%.
It would have been almost double the reported rate.
So, yes, there are different ways to calculate it.
You get different answers.
Now, I think, by the way, I've anticipated this problem in a sense, because I calculate Hahnke's annual misery index each year for 157 countries.
And I include interest, borrowing costs, and that thing.
My index is what? We have the inflation rate, we have the borrowing costs, and we add to that a third item, the unemployment rate.
Those are all negatives.
Those are all miserable things.
Inflation goes up, it makes you more miserable.
If your borrowing costs go up, it makes you more miserable.
And then you subtract from that GDP per capita, that's a positive thing.
If your income is going up, that's good.
So you subtract that from the three bads and you get Hahnke's misery index.
So last year, the most miserable countries in the world, Argentina, then Venezuela, then Lebanon, then Syria, then Zimbabwe.
Now, if we look at the least miserable countries, the least miserable was Thailand, then Japan, then Switzerland.
Well, all those have very low interest rates and low inflation.
So that's why they come in least miserable.
So in a nutshell, this isn't some conspiracy or anything like that, in my view.
These are professional people at the Bureau of Labor Statistics coming up with these indices.
But there's a lot of subjective judgment that goes into what should be in the index.
And most recently, early this year, former Secretary of the Treasury, Lawrence Summers, who's a professor at Harvard, and three other co -authors that he had produced a paper at the National Bureau of Economic Research where they get into this business of the 1983 change and they make the point, which I
think is valid. Given my misery index, they say, everyone's wondering why the economy's supposed to be doing pretty well in the United States.
Inflation's coming down, the economy, labor market's tight, the economy's growing, stock market's pretty hot.
But why are people so fed up with Biden's economics and Biden?
And they say it's because financing costs, the interest is much higher than it was when Biden came into office.
And as a result of that, that's the borrowing cost thing, an interest.
And if you include interest in there, you of course get a much higher CPI, and that's why people are really so fed up.
They're not so fed up with a consumer price index, maybe, as it's coming down.
But they argue if you actually calculated things the old way, the inflation rate would be a lot higher, and that's what's bugging people.
And it would be a lot higher because their financing costs are a lot higher.
Your credit card, that is costing you more.
If you go to the bank, it's costing you more.
Your mortgages are costing a lot more.
Mortgages in the United States, they've essentially made housing unaffordable.
Right, right. So my understanding is that the GDP is actually after factoring in inflation.
So we get kind of a net growth because inflation has already been calculated in.
So if we were to use any of these other ways of calculating inflation, for example, there's a site called shadowstats .com, and they claim that if we were to go back to the way we calculated inflation in 1980 or 1990, that the inflation would be well above 10%, and then therefore, GDP would be contracting
that entire time. What is your take on that?
They're kind of mixing apples and oranges.
Shadowstats is good because you get a good number that's a broader measure of money, a proxy for what they call M3 is put out by shadowstats, which is a great service because the Fed doesn't put it out anymore.
So you have to go to shadowstats to get it, or you can get it at the Center for Financial Stability in New York.
The Center for Financial Stability in New York actually has M3 and M4, they even have broader.
So if you really wanna get into broad money measures, you have to go really to the Center for Financial Stability.
And there you get, I'm a special counselor there at the Center for Financial Stability and the kind of guru on measuring money and changes in the money supply as Professor William A.
Barnett, Bill Barnett, great expert on this, probably the world's greatest expert on measuring the money supply.
But let's talk about this thing where shadowstats is getting actually mixed up.
GDP, to calculate the inflation adjusted GDP, you've got to use a GDP deflator, not a consumer price index.
Consumer price indices indicate changes in the cost of living.
That's what they're supposed to do.
But the GDP deflator is another index by the way, another price index that's used to adjust nominal GDP and translate it into real GDP.
So shadowstats, it's just an apples and oranges.
They should be using a GDP deflator.
And if they were, the GDP deflater is deflating in an orthodox, appropriate way.
Let's put it that way.
So many of us, when we go to the grocery store, we can't help but notice the concept dubbed shrinkflation.
It just, I've gone to some sites, they give examples of cereal, ice cream, paper towels, experiencing effective shrinkage of 11, 17, and even 29 % cause some of these shrink so much over time.
How much is shrinkflation impacting the real effective inflation?
And does the government accurately really take that into consideration?
I mean, apparently the, I saw the site that said the BLS claims shrinkflation only has had a total effect on food of just two and a half percent spread out over a four year timeframe from 2019 to 2023.
How, what's your take on all that?
Well, number one, this is a question for specialists who are measuring things.
Now, it turns out I actually know quite a bit about measurement and the society for measurement.
I'm one of the original members of that.
And the society, so I don't know the answer because I haven't been out in the weeds measuring this kind of stuff.
Let me point out, go back to our original conversation about the indices, price indices.
This is another problem with price indices is actually measuring things.
So and shrinkflation is part of the whole measurement problem.
It's just another problem to put in there.
And it's a problem associated with all kinds of economic aggregation and all kinds of indices.
It's inherent in the animal.
And by the way, you can't make any kind of reasonable observations or modeling or anything else without using economic aggregates.
So you have lots of measurement problems.
It just comes with a territory.
So if you focus on one thing like shrinkflation and the size of a box of cereal or something like that, this is a problem.
And there's no way to get around it.
It's just inherent.
I don't make a big deal out of it.
I say, yes, of course, I agree.
It's a problem. How do you measure this thing?
And if you go back, for example, one of my professors, this goes back many moons.
I've been around for a long time.
I'm in my 54th year at the Johns Hopkins University as a professor.
One of my professors was a famous professor, Kenneth Boulding.
He was president of the American Economics Association.
And Boulding has a great chapter in his two -volume book on economic analysis, the macroeconomics book.
I think the second chapter is on index numbers and aggregation.
It goes through all of this stuff.
They don't even teach this anymore, by the way.
Most economists have no idea what we're even talking about.
Now, at the official US government people, believe me, they know a lot about index.
Or if you take somebody like Bill Burnett, he's a professor at the University of Kansas, but he's also a fellow at the Center for Financial Disability.
He's probably the world's expert on index numbers.
I mean, it's a highly, highly technical field.
And what are they trying to do?
They're trying to measure not two things, the volume of something, as well as the price of something.
If you multiply P, the price, times the quantity, Q, you get something called the total value of whatever it is in the box.
So this is just a huge, huge problem.
By the way, one of the best books, I'm gonna turn around, I'm at my own library, by Oscar Morgenstern, very famous economist, mentor of mine, on the accuracy of economic observations.
I mean, I look at this thing every week, even though it was published originally in the 1960s, let me see the publication date, 1965, it remains, I think the best overall treatment of all these major problems.
I'd like to transition to a topic of gold and with the long overdue breakout of gold to new highs, quite a few gold bulls are saying that this is a sign that investors in central banks are protecting themselves from reckless governmental financial policies and an inevitable dollar weakening.
What is driving gold?
I am a gold bull, by the way, if we're getting into confessionals here.
So that to preface my remarks, it's something that I've traded and I've followed for many, many years.
But what's going on is pretty interesting because the gold breakout, normally, by the way, the dollar is extremely strong.
The dollar is in a huge bull market.
And usually when that happens, gold is not in a bull market.
If you get dollar strength, you'll get gold weakness, usually, but that's not the case now.
So that makes this breakout kind of unusual because after all, the dollar is the international currency and very important.
The dollar -euro rate might be the most important price in the world or maybe the dollar -gold ratio, one of the two.
But at any rate, what you find is that central banks are buying, and the central banks that are really buying big time are China and Russia and their strategy is to de -dollarize.
They wanna have something on the balance sheet that's not issued by a sovereign.
Gold is not a liability of any sovereign.
So they get away from the politicization of things and the politicization, potentially, of fiat currencies, they get away from that.
So that's one thing in the background, that's a positive.
And then you look at non -central bank buying, shall we say, outside of China.
I'll come to China in a minute.
Shall we say, in the West?
And that's actually been quite weak.
If you look at the ETF holdings, they've been going down.
You look at bullion sales, they've been going down.
You look at premiums on physical gold being sold in Singapore, the premiums are low, not high.
So all of that indicates that there's not a strong demand in the West that shall we say, the retail or non -central bank retail and wholesale markets.
So where's this juice coming from?
It's all coming from the retail and wholesale markets in China, it's a China story.
And then commodities, by the way, in general, it's all a China story, all commodities.
Now you get some oddball things like cocoa right now.
Cocoa's gone to the moon.
It's backed off a little bit in the last few days, but that's because of weather conditions and the fact that they haven't been maintaining these plantations in the Ghana and the Ivory Coast properly.
So the yields are very low and just a huge shortage is built up in cocoa.
So you get a few things that aren't China -centric but most commodities, most industrial commodities and even some soft commodities, agricultural commodities are all driven primarily by what's going on in China.
I've heard for many years, I've heard gold bulls argue that for every physical ounce at the COMEX exchange, 50 or a hundred paper ounces are traded.
And that if just one or 2 % of those currently long, the paper contracts actually stood for delivery, that it would blow up the COMEX and would create the mother of all short squeezes due to a lack of physical inventory.
Is this even likely or is it just another hyped up implausible narrative?
I think it's probably a hyped up plausible, but black swans can always creep into the pond.
So you never know. I'm not saying never, never, but my knee jerk reaction, I don't pay much attention to this kind of stuff.
I'm a very plain vanilla gold bull.
I'm not into all of this stuff going around.
I literally don't spend one second even looking at it.
Great, yeah, I'd like to jump into GDP and the multiplier effect.
Now I've searched chat GPT, I've gone to many videos and I cannot find an answer to this.
So I'd love to get your take on.
So from my understanding, Econ 101 taught us that when a dollar is spent into the economy, more than a dollar of GDP is generated due to the chain of businesses and people who will receive parts of that dollar and spend it themselves.
So when I did a little bit of just simple digging, I was shocked that in 2023, the US borrowed 3 .1 trillion, but only 2 .3 trillion of economic activity was generated as measured by GDP.
Meaning $800 billion was borrowed, presumably spent, but generated zero economic activity.
How is this even possible and where did all that money go?
Well, this is getting fairly complicated.
Let's go back to Econ 101, the multiplier, a Keynesian multiplier.
Let's keep it fairly simple.
A Keynesian multiplier is roughly speaking something like this.
If you increase the fiscal deficit in the country, there's a multiple effect, a multiplier effect.
And you can work this out with, the marginal propensity consume and there's a little formula, even you learn in principles economics that shows you the multiple, you'll increase, increase a deficit and you on a multiple basis will increase the level of GDP.
Or alternatively, if you tighten up fiscal policy, you get a reversal of that with the multiplier, the negative factor.
So that's what people learn.
And that's why they say, well, fiscal policy, they always talk about monetary and fiscal policy.
That's the macroeconomic tools and fiscal policy is a big tool.
And if you run a fiscal deficit, you goose the economy because of the multiplier effect.
Well, it turns out that, and one of my former colleagues and collaborators, Sir Alan Walters did a lot of work on this.
And what he found was that if the fiscal deficit and debt to GDP ratios were kind of in a moderate zone, yes, you do get a, tend to get a positive fiscal multiplier and a goose when you increase the fiscal deficit.
But what if the fiscal deficit's pretty large and outside this kind of normal zone and the debt to GDP ratio is large?
Well, then if you increased and get further away from the norm, the deficit, you actually get a negative multiplier because confidence is hit.
You get a negative confidence shock because people are afraid that what's gonna happen, that the central banks will monetize that extra deficit.
And if they monetize it, they're gonna get more inflation, not real economic growth.
And so that's the line, that's how to interpret these negative fiscal multipliers.
The Keynesian textbook theory is that the fiscal Keynesian multipliers are always positive.
That's not correct.
If you look at the actual data and they turn negative when the fiscal deficit and debt ratios become too big.
So that's one zone that we're getting into.
Now, you're talking about something that I think is a little bit different, I think.
It's not clear. This is a danger with Googling around, by the way.
I'm very opposed to all of this Googling everybody is doing, including you because to make any sense of Googling, you have to have a theory before you start Googling.
And if you don't have a theory, you're just in a mass of confusion, confusing yourself.
And if you listen to these financial reports on the television or radio or on YouTube podcast, it's just a mass of confusion out there because there are very few people who have their theory straight on the thing.
So what I think, my interpretation of what you started with was this borrowing and somehow the level of transactions that go on are a lot higher than the final GDP.
And that is true because there's something called gross output.
And if you look at the measure for gross output, that measures all the transactions in the supply chain.
There are lots of intermediate things happening before GDP.
GDP is the measure of the final value of goods and services produced in the economy.
It's the final, it's kind of the bottom line.
But before you get there, you've got the miner who's mining the raw material.
And then you've got, and he sells it for some value to a processor and the processor then processes it, maybe several stages of processing.
And then fabrication comes after that.
All these things are sales going on.
And that's what gross output measures.
And that will always be way greater than, typically greater than GDP, that number.
And what's interesting about gross output right now, that is something I follow as an Austrian economist, gross output's very important.
And the big advocate of this and guy who's been promoting and doing a good job of it is Mark Skousen, Professor Mark Skousen has been doing this work.
I've written about it supporting Skousen's work because I think it's first grade, but gross output now, what's going on?
Remember I said a recession is baked in the cake because of monetary theory and the contraction in the money supply.
But also another compliment to what I said and reason for why I think we're going to have a slowdown is that gross output has been growing at a slower rate than GDP for the last couple of quarters.
And that means transactions going on in the background, in the background of GDP, the rate of those transactions has been going down.
So are you saying that GDP is not really a great indicator to get for the output of the economy?
Because when I went back and I looked at five year periods going from 1971 to 1976 and then all the way to today, that back in that 40, 50 years ago, we had a positive multiplier.
In fact, from 71 to 76, we had a 3 .3 positive multiplier means for every dollar we borrowed and spent, we got $3, wasn't 30 cents added to the GDP.
But since 2006, for every five year period since 2006 has generated a multiplier of less than one, which I thought was supposed to be impossible.
I mean, how can GDP grow less than the amount of the debt that was borrowed and actually spent into the economy?
Well, looking at it from the perspective of the gross output measure and GDP, you'd expect GDP to be lower than gross output.
Without looking exactly at, it's this multiplier in the debt thing that you're looking at, I can't intelligently really comment about it.
I can comment intelligently about gross output and its relationship to GDP.
They're just measuring different things.
We've had a lot of this conversation and it's been about measurement of different things.
GDP tells you something different than gross output.
They're just two different things.
And the question is how do you, as an analyst and as economist, how do you put these things together and understand them and the relationships that exist over the business cycle, for example.
And that's one thing, over the business cycle.
The other thing you've got to understand is more or less what you're getting into.
And that's a secular thing, is something over the long run happening here.
Is a structure of the economy changing in some way that's making these various measures and the relationships to one another change over time.
So there's a lot going on here.
Excuse the last interruption here.
This is Tessa. We hope you're enjoying this episode so far.
If you love the podcast, please give Chat with Traders the best review you can on whatever platform you're listening from.
This will help us to keep the episodes coming.
Also, if you haven't subscribed to our email list, please hop on to chatwithtraders .com and click on subscribe so we can keep you posted of information that may be of importance.
Thank you. Now back to the chat with our guests.
Very often quoted, debt to GDP figures for this country or that country are put out.
And we see that for the vast majority of countries, debt to GDP is rising, meaning that the GDP is growing less than the amount of new debt taken on and spent.
Is that anything to worry about?
Is it just kind of like - Yeah, okay, it is something to worry about because that ratio is over 100 % in the United States.
And it hasn't been that high since right after World War II.
So this is unsustainable.
The nonpartisan Congressional Budget Office has come out with a series of reports recently indicating that this can't go on.
It is not sustainable.
And when something is not sustainable in economics, it will stop.
Now, the question is, how are they gonna stop it?
How will it stop if it isn't sustainable?
And I've already said, you got only one of two ways to do it.
Either you increase taxes or you reduce government spending, or, and when I say increased taxes, there are two ways to do this, Ian.
One is that they send Hanky a larger tax bill.
And the second way is kind of a phantom thing.
They don't send Hanky an increased tax bill.
They present more inflation in the economy.
So everything Hanky is buying costs more or he faces shrinkflation and all this other stuff we were talking about.
So there are only two ways to tax direct taxation or indirect taxation through inflation.
One of those two things is gonna happen if you want to increase taxes.
And we know if you wanna reduce government spending like Bill Clinton did, you reduce government spending.
Now Clinton, by the way, had a great advantage.
And remember he was president right after the Soviet Union collapsed and communism collapsed.
And so there was what we call a huge peace dividend.
The defense expenditures went down, down, down.
And that was a peace dividend.
So that's one, he had a lot of wind that he's back to reduce that government expenditures.
So in brief summary, is there any way, are there any key indicators?
Easy to find indicators where we can measure the effectiveness of government spending.
Are they blowing it on a lot of malinvestments or are they putting it into projects that actually generate a very positive return thereby spending our tax dollars very efficiently and wisely?
Is there any way we can measure this?
Not really, because here's the problem.
In a profit and loss system, this kind of thing's measured all the time because at each quarter or at the end of the year, we get a financial on companies or even if they're not public companies, publicly listed for a private business, you have the same thing.
At the end of the year, we've got their financials.
So if you have profits, you'll stay in business.
You might even grow.
If you have losses, you're eventually gonna go bankrupt and go out of business or stop supplying whatever is causing the losses.
So ex post facto, we have a measure in the profit and loss system.
That's the beauty of it.
At the end of every year, the books come out and you can see whether you've made a profit or loss, you know what the rate of return on capital has been.
But that doesn't happen in the public sector.
They come up with all this pie in the sky spending and no one ever looks at ex post facto at the government.
So we can't look anyplace.
We have nothing equivalent to a profit and loss statement for the government expenditures.
So that's the answer to the thing.
And that's why we know it must be very wasteful.
And the reason for that is that decisions are being made by people who don't pay the cost of the mistakes that they make.
And therefore, we have a lot of bad decisions.
By the way, the only studies that have been done, and I have done some of these ex post benefit cost studies because that's one field not so much anymore, but I used to specialize in this, especially with these big infrastructure projects and water projects.
And none of those had in fact generated benefits greater than cost.
The ones that I looked at, big water resource projects, they were all losers.
The governments tend to get into mega projects, these big projects.
This is what's happening right now with Biden by the way.
He's very big into what we call industrial policy.
And that's where the government is making all these decisions.
And if you look at, for example, the inflation reduction act, the Congressional Budget Office predicts, this is ex ante before, they predict it'll cost 391 billion in 2022 to 2031.
Goldman Sachs estimates it'll cost 1 .2 billion.
Well, big difference.
So a huge difference.
And those are ex ante estimates, not ex post.
Sorry, did you mean 1 .2 trillion?
1 .2 trillion, I'm sorry, 1 .2 trillion.
Wow. Yeah, thanks for catching me on that.
So here's what you have with government programs.
You have what I call, Hanky's Iron Law of Industrial Policy, over budget, over time, under benefit, over and over again.
So one malinvestment after another?
And why wouldn't you have that?
If you were in the private sector, you can't get by with this, because eventually if you have low rates of return on capital and you're a publicly listed company, the stockholders are gonna send you a pink slip.
And if you're in the government, what happens?
No one even looks at it.
I'd like to dump to, I've heard a lot of progressives argue that this new modern monetary theory, MMT, this new invention is the key to helping us improve our economic situation.
What are your thoughts on MMT?
Oh, it's absolute rubbish.
The essence of it, the bottom line is that the government deficits don't matter.
In short, it was a little like catching the flu.
When the pandemic came, we had COVID, but the politicians caught MMT and started spending money like mad, huge fiscal deficit, 90 % of the deficit was monetized by the Fed, so the money supply shot up.
The money supply in February or March of 2022, I can't remember the month though, but at any rate, early 2022, it peaked out at growing 27 % year over year.
That's the highest it's ever grown and since the founding of the Federal Reserve in 1913.
And the golden growth rate, Hahnke's golden growth rate is about 6%, that's the rate consistent with the 2 % inflation.
So we had this huge increase in the money supply due to people believing in MMT.
And what did we get?
Well, we got a lot of inflation.
This theory is utter rubbish.
So getting back to the contraction of the money supply, so from my understanding, our current contraction of the money supply is, I think the last time you said it was in 1940s was the last time that we've had a contraction of the money supply, but couldn't one argue?
It's like, well, it's not really a big deal because we're just taking some of the cream off the top because we had an explosion of money supply growth in 2020 and we're still just getting back to trendline.
So who cares if we're contracting the money supply, we're just taking the excess off the top.
Well, yeah, the excess has been taken off the top.
That's true. If you divide GDP into M2, that's a cash balance.
It's the inverse of velocity of money.
If you do that computation, you'll see that we had, the trend is that that ratio increases in the US at about 1 .7 % per year.
That's the trend rate.
But of course, it exploded way over that and you get a big hump of excess cash balances that were in the economy and M2 divided by GDP went way up above.
The trend rate of growth of about 1 .7%.
And now it's back down to the trend rate and the contraction starting to bite.
So quick thought on the general stock market from you.
I've learned from decades ago, the old saying, don't fight the Fed.
And yet interest rates are so high relative to where they were before and you got a contracting money supply, but the market seemed to be inflated very highly.
What's wrong with this picture?
Oh, they are inflated.
If you look at the inflation adjusted PE ratios, it's something, Robert Schiller at Yale, he's a Nobel Laureate.
So he has an adjusted price earning ratio called CAPE.
And right now it's reading around 35, roughly.
And that's higher than the monthly reading since 1881 for 95 % of the months.
And the highest we ever had, by the way, was the dot -com fiasco in 2000, remember that.
Then it got up to about 45.
That's about 35, but the 35 number has not been realized since 1881 and only 5 % of the time.
So all it's saying is that the stock market is very pricey now.
And by the way, the thing has been driven by the magnificent seven, some of this IT stuff, so the diffusion of the market, the dispersion is pretty thin.
Again, it's an index.
We got talking about CPI, the Dow Jones and S &P, all these things are indices with a bunch of stuff in them.
And we've got a few things that are pushing these indices way up and a bunch of other stuff that really isn't doing that great.
But the index itself is very pricey.
So it sounds like you're saying that some of the components of the index are artificially elevating it to levels and masking some of the underlying weakness.
That's, I would agree with that comment.
Well, great. So to wrap things up, do you see anything that brings you some optimism?
One thing that brings me a little optimism, it looks like China has kind of hit bottom and is coming back a little bit.
That's a tentative statement.
We have only a few data points and so forth, but that looks like the case.
So all of these critical materials like lithium, for example, which has crashed, as you know, I think it's coming back.
So yes, as a lithium bull, that makes me very optimistic.
Great. Well, Professor Hanke, it's an honor and it's a pleasure speaking with you today.
Thank you for coming on chat with traders.
Great to be with you.
I look forward to joining you again.
Nothing better to chat about than trading commodities.
Yeah. If, how can our listeners get in touch with you?
The best way on Twitter, it's at Steve underscore Hanke.
So that's pretty regular.
That's, you know, a lot of regular stuff.
The other way they can just send me an email, hankie at J h u dot edu.
And I'll put them on my distribution list.
If people, if people request, I'll do that.
That way they get long, longer articles, and things like that.
Great. Thanks again.
You're welcome. You've reached the end of this episode of chat with traders, but rest assured, there are more episodes loaded with real market insight and zero hype on the way soon.
So to stay updated with each great new release, subscribe to the podcast and iTunes.
And we'd love it if you'd leave a rating and review.
We'll catch you next time on chat with traders.
Thank you.